Monitor three phases together
This page builds one monitor for the three phase currents of a charger, L1, L2 and L3, in the pipeline composer. It explains why the phases belong in one monitor, then sets it up step by step. The same design fits phase voltages or any group of readings that should move together.
Audience
- Operators who create monitors in the pipeline composer.
Why one monitor for three phases
The three phases of a charger carry the same load. When a car starts charging, when load management lowers the current limit or when the battery tapers off at the end, all three move together. That shared movement is the common mode. It is large, frequent and normal, so a monitor that watches each phase on its own learns that big jumps are normal, and then misses the faults that matter.
Those faults show up as a phase that moves differently from the others: a phase that drops out, a step in the imbalance, a sensor whose gain drifts, or a reading that sticks while the others go on. That is the differential mode. It is small next to the load changes, but it is exactly what a healthy charger does not do.
So the monitor below takes the common mode out first. It divides each phase by the mean of the three and subtracts 1, so a phase at the mean reads 0 and one that carries 4 % more reads +0.04. Load changes cancel, and what is left is the balance between the phases.
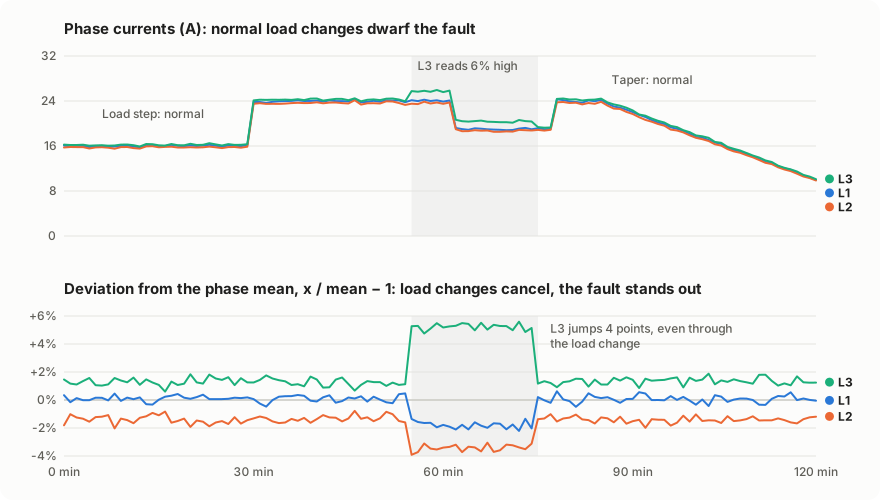
The deviations also keep the normal imbalance of a charger, such as L3 always sitting a little above the others. A detector learns that standing pattern from a training period and reports when the pattern changes. A Static baseline fits this well: it learns from a fixed reference period, so a fault that develops slowly, such as a drifting sensor, does not become the new normal.
What you build
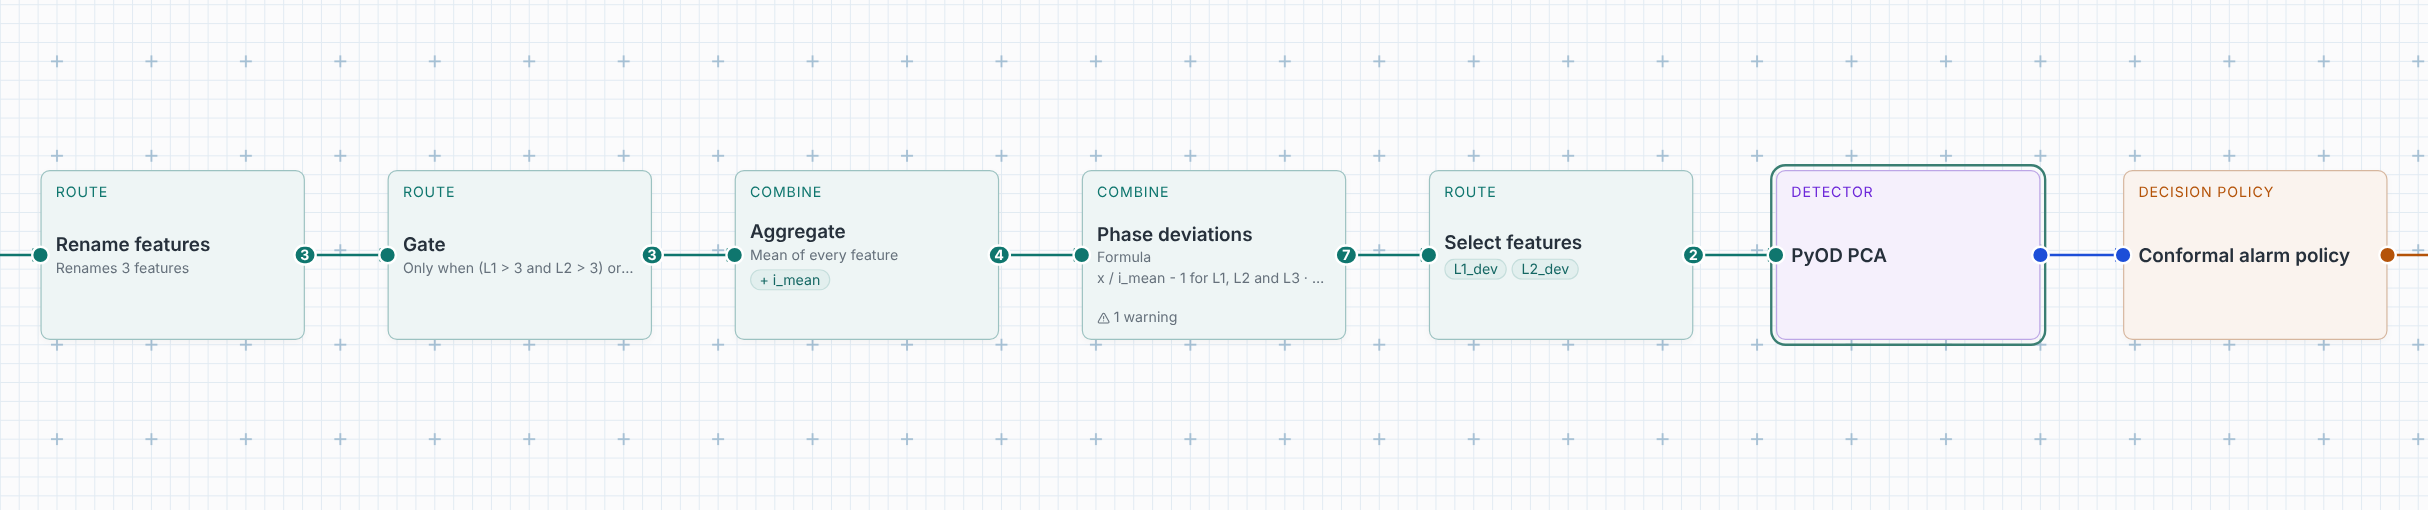
| Step | What it does here |
|---|---|
| Rename features | Gives the readings short names, L1, L2 and L3, to write formulas with. |
| Gate | Monitors only while the charger charges on at least two phases. |
| Aggregate | Adds the mean of the three phases, i_mean. |
| Formula, for each feature | Adds L1_dev, L2_dev and L3_dev: each phase over the mean, minus 1. |
| Select features | Hands two of the deviations, L1_dev and L2_dev, to the detector. |
| PyOD PCA | Learns how the deviations normally relate, and scores how far an observation strays from that. |
Step by step
Open Monitoring, then Create.
1. Choose the readings and the strategy
Under Choose monitoring inputs, pick the charger and check its three phase currents. Name the service, for example Charger 07 phase balance. Set Strategy to Static baseline. The composer starts with the inputs, a detector, an alarm policy and the evidence output, already connected.
2. Rename the readings
On the wire after the inputs, choose + and Rename features. Under
Mapping, write L1, L2 and L3 next to the three readings.
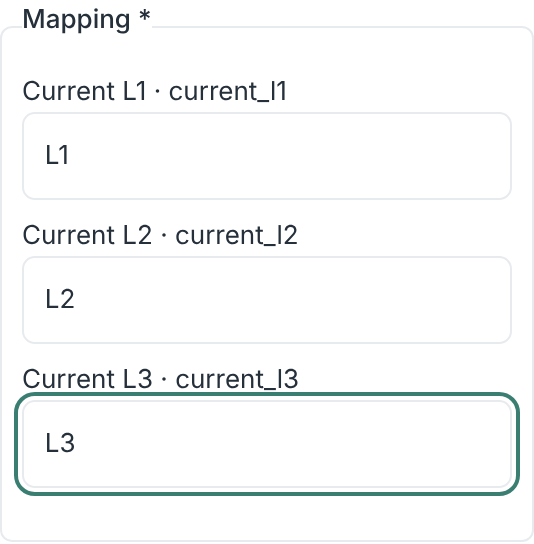
Renaming is optional. Formulas can use the reading names as they are, but short names make the next steps easier to write and to read.
3. Monitor only while the charger charges
Insert a Gate after Rename and give it this condition:
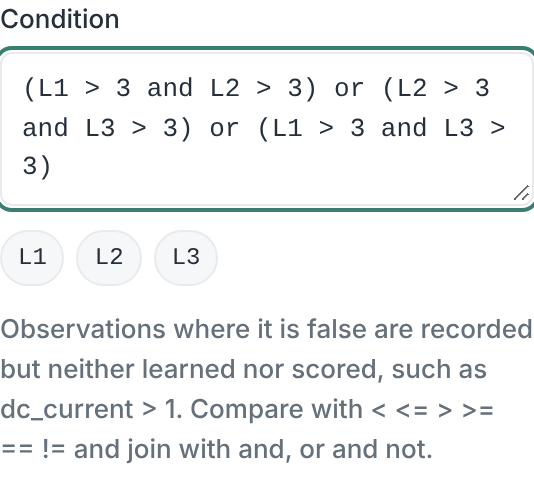
The condition holds while at least two phases carry more than 3 A. Between sessions every phase is near 0, and dividing by a mean near 0 makes no sense. The Gate also keeps idle time out of what the detector learns. Observations the Gate holds back are recorded but neither learned nor scored, and they do not count as coverage gaps. Requiring two phases, not three, keeps a monitor running when one phase drops out, which is one of the faults you want to see. A car that charges on one phase only is not monitored; that is normal and not a fault.
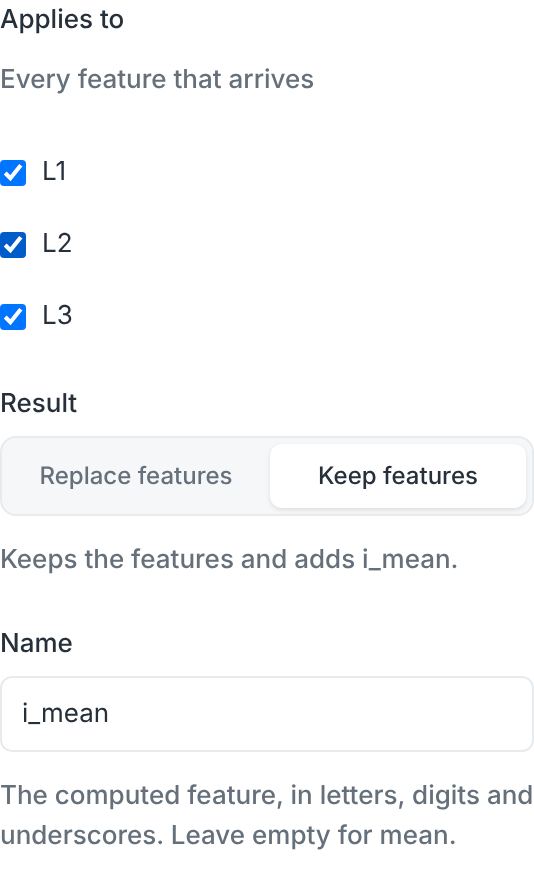
4. Add the mean of the phases
Insert an Aggregate after the Gate. Leave Function at Mean and
Applies to at every feature, set Name to i_mean and choose Keep
features, so L1, L2 and L3 stay and i_mean is added.
5. One formula for all three deviations
Insert a Formula after the Aggregate and choose For each feature. The
composer checks the readings that arrive, here L1, L2 and L3, and leaves
i_mean unchecked. Write:
x stands for each checked feature in turn. Choose Add new features and
set Suffix to dev. The step now adds L1_dev, L2_dev and L3_dev, and
the sentence below Result names them. A step title such as Phase
deviations makes the card easy to find.
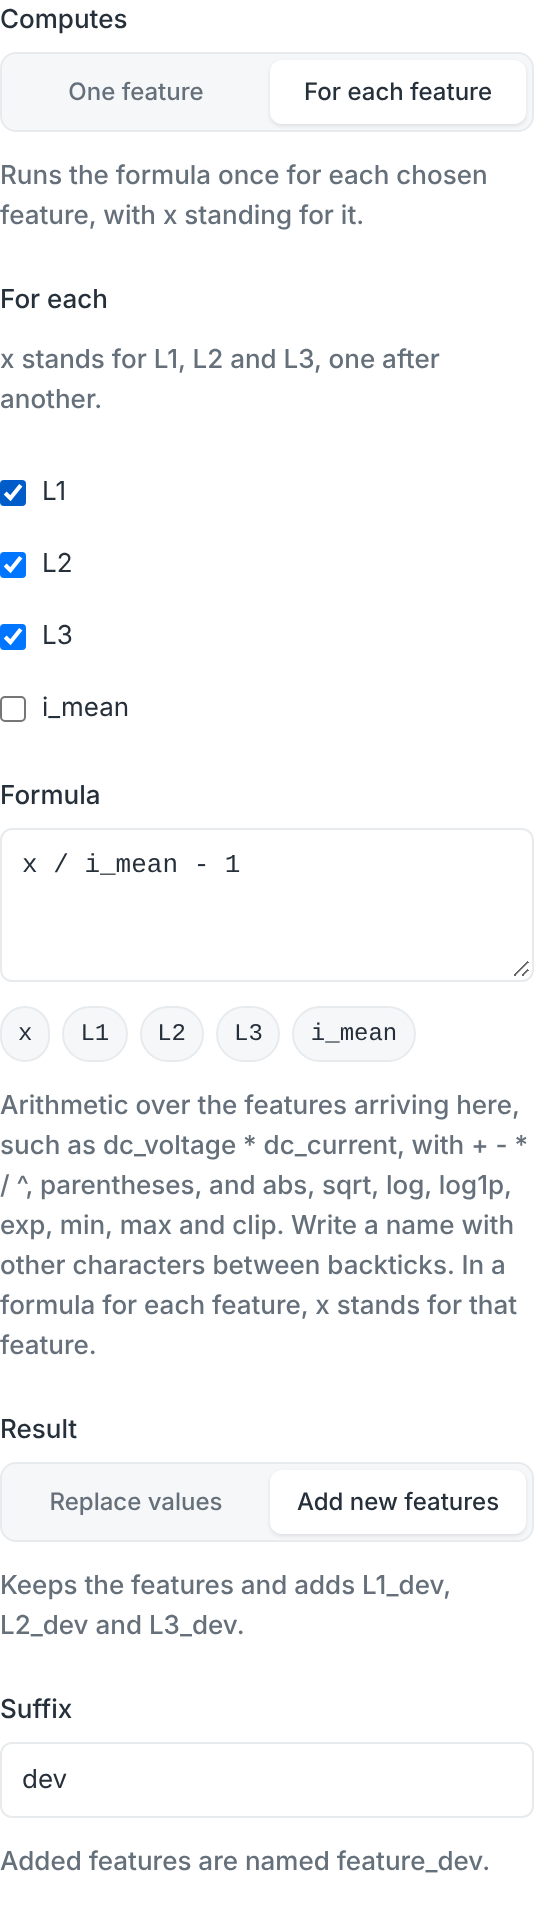
The card shows one warning: Division by i_mean: observations where it is 0 are skipped. The check cannot tell that the Gate already rules this out, so the warning stays. It does not block the monitor.
A single Formula for each feature replaces three separate ones, such as
L1 / i_mean - 1 named d1 and so on. Both compute the same values; the
single step is shorter to set up and keeps the three in step when you change
the formula.
6. Hand the deviations to the detector
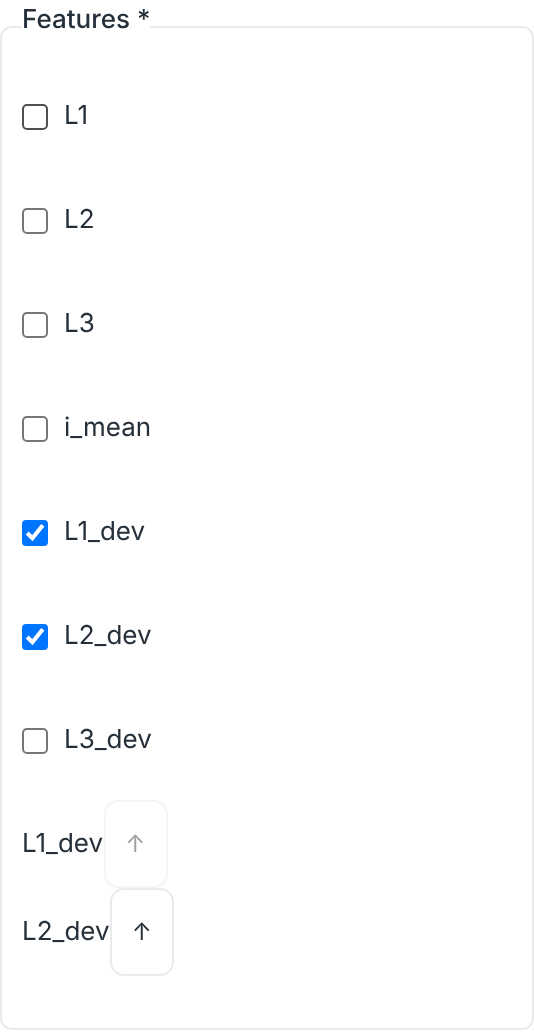
Insert Select features after the Formula and check L1_dev and L2_dev.
The detector then sees only the balance between the phases, not the load.
Two are enough. The three deviations always add up to 0, so L3_dev is minus
the sum of the other two and carries nothing new. Handing all three to a
detector also makes it numerically unstable: their spread is exactly 0 in one
direction, and PCA divides by that spread. A change in L3 still shows, because
it moves the mean and with it L1_dev and L2_dev.
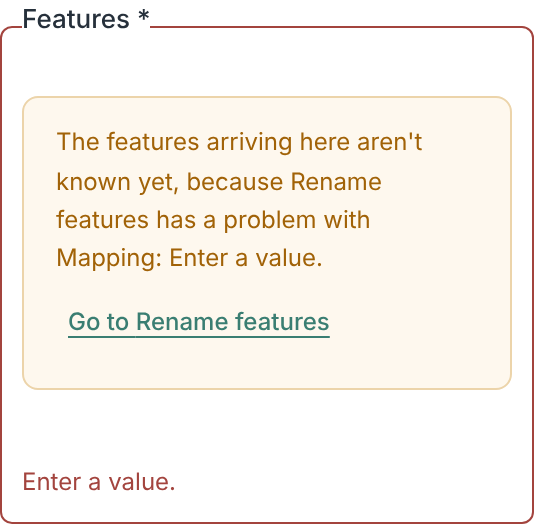
If the list stays empty and says the features aren't known yet, an earlier step has a problem, such as a Rename with nothing filled in. The message names that step, and Go to opens it. Once it is fixed, the list fills.
7. Choose the detector
Select the detector card and set Detector model to PyOD PCA. PCA learns the directions in which the deviations normally vary together during training, and scores an observation by how far it lies outside them. A phase that drifts, drops or sticks breaks that pattern even when every single value is in a normal range. Leave the alarm policy as it is to start with.
8. Check what the detector receives
Switch from Graph to Features. Each row is one feature the detector receives, with the reading it follows and the steps that change it. The Gate's condition sits above the rows, because it decides which observations reach all of them.

The validation badge should read Valid with the one division warning from step 5. Start monitoring starts the service.
Training period
A Static baseline learns from the first observations that pass the Gate, then calibrates, then scores. The badge says how long that takes at the readings' usual rate, such as first alarm after ≥ 4 h 20 min; with a Gate it is at least, because held-back observations do not count. Train on a period with several ordinary charging sessions at different currents. If the charger has a known fault at the time, wait until it is repaired, or the detector learns the fault as normal.
Reading the chart
The chart of a running service shows the readings, then a Detector inputs
pane with L1_dev and L2_dev, then the sequential evidence. The deviations
show what the detector sees: they stay flat through load changes and step when
the balance between the phases changes. The evidence pane shades the alarm zone
above the threshold. Readings newer than the last scored one count as awaiting
score. While the Gate holds readings back, for example between charging
sessions, that count grows; it is not a backlog, and it resets once a reading is
scored again.
Variations
- Phase voltages. Use the same steps with the three voltages and a Gate such
as
min(V1, V2, V3) > 100to skip outages. - Adaptive stream. With an adaptive strategy, Aberrant MovingMahalanobisDistance on the same two deviations works the same way. An adaptive detector keeps learning, so it follows a slow drift instead of reporting it; use a Static baseline when slow faults matter.
- One number for the imbalance. A Formula such as
max(abs(L1_dev), abs(L2_dev), abs(L3_dev))gives the largest deviation as one feature, for a univariate detector or a chart.
Monitoring describes every step and setting in the composer.