User guide — web app
This page explains end-user workflows in the React frontend.
When to use this page
Use this page for account, device, favourites, monitoring-service, and anomaly workflows in the UI.
Audience
- Platform users and operators interacting with the web app.
Main routes
| Route | Purpose | Access |
|---|---|---|
/register |
Accept an invitation and set a password | Public |
/verify |
Retired; redirects to /login |
Public |
/login |
Sign in | Public |
/forgot-password |
Request a password reset | Public |
/reset-password |
Set a new password with a reset token | Public |
/ |
Monitoring services and selected-source evidence | Authenticated |
/details/:chargerId |
Telemetry details for one charger | Authenticated |
/services |
Legacy link to Monitoring | Authenticated |
/sources |
Sources: configure brokers, HTTP APIs and recorded readings | Authenticated |
/anomalies |
Reporting: review recent anomaly events | Authenticated |
/dojo |
Dojo: datasets, labels, offline runs and comparisons; ?dataset=<id>&tab=values\|runs\|compare opens one dataset |
Members who may use the Dojo |
?settings=<section> |
Settings overlay above any workspace page: account, preferences, catalogue or status |
Authenticated |
/account |
Legacy link: opens the Account settings section above Monitoring | Authenticated |
/system/status |
Legacy link: opens the System status settings section above Monitoring | Authenticated |
Workspace navigation
All navigation lives in one sidebar on the left; there is no top navigation bar. From top to bottom it holds:
- Aberration (the logo), which returns to dashboard home, and the Hide sidebar control.
- Workspace: Monitoring, Sources, Reporting and, for roles with the Dojo permission, Dojo. The current workspace is highlighted. Device details opened from a report keep Reporting highlighted. Pipelines and datasets stay where they were: in Monitoring and in Dojo.
- Favourites: your starred readings and devices, when you have any.
- Collections: the catalogue's shared collections, when it has any.
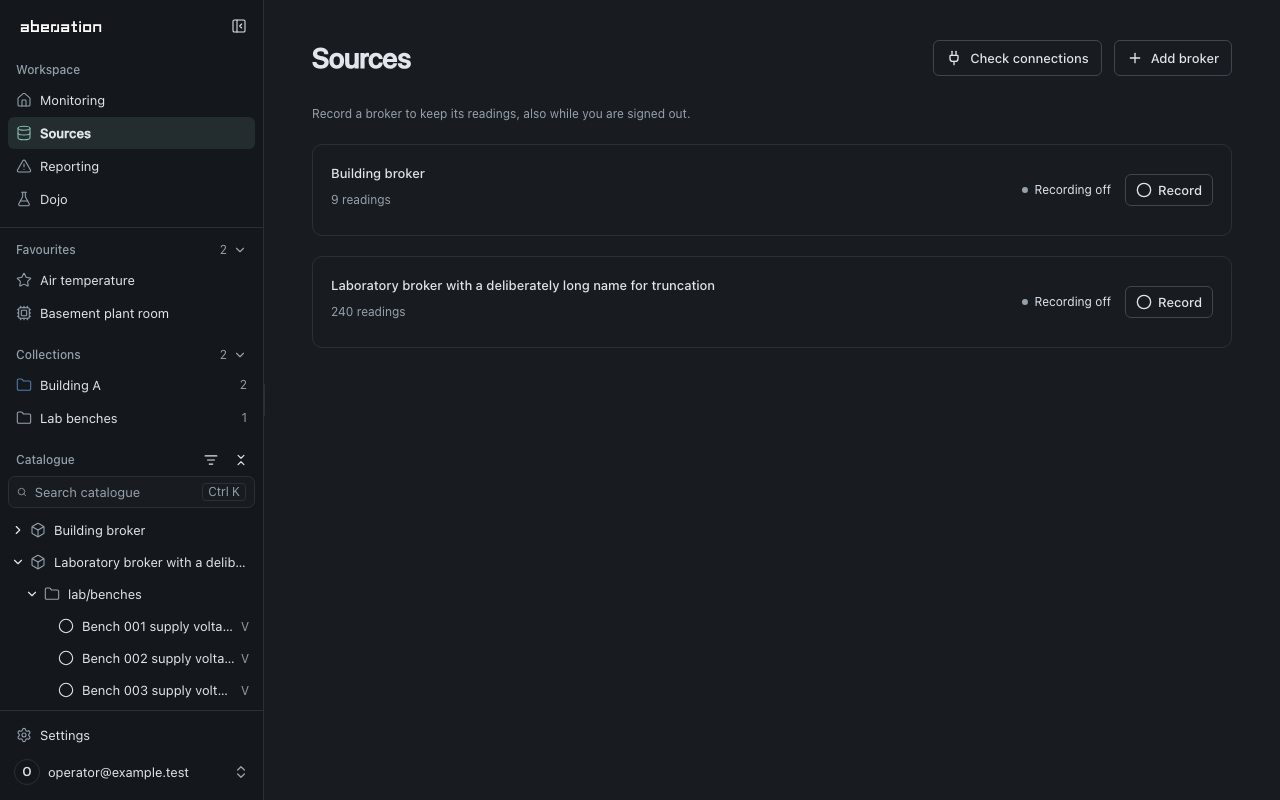
- Catalogue: search and a tree of brokers, devices, MQTT topic levels and readings.
- Settings and your account at the bottom. They stay in view however long the catalogue is.
Favourites and Collections fold away from their headings, and the sidebar remembers which are folded.
Choosing a source
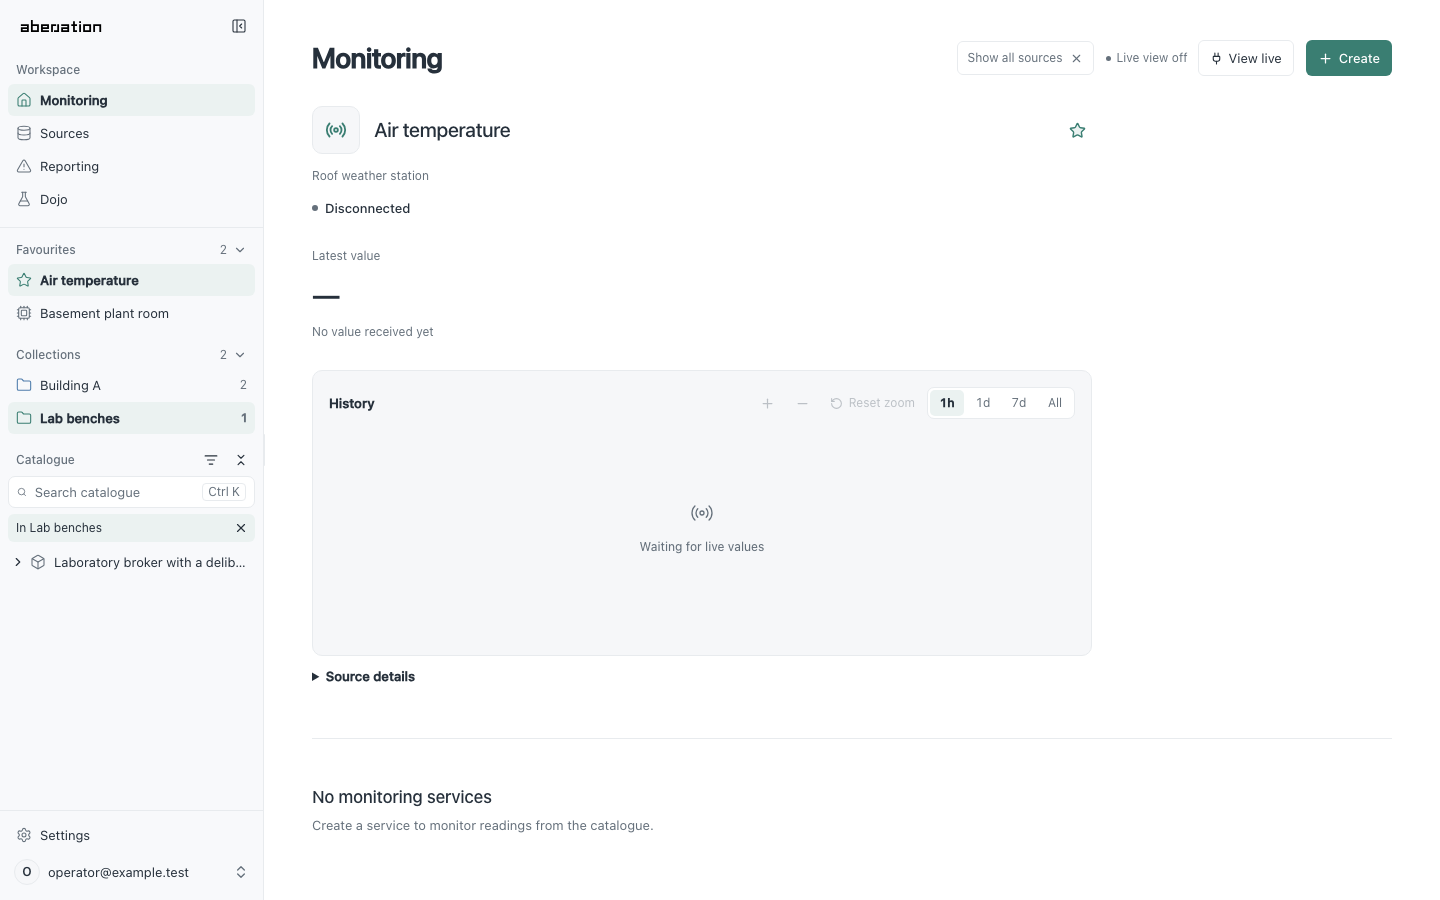
Selecting a catalogue row, or a favourite, chooses that broker, device, topic or reading as the source for the current workspace. Monitoring shows its services and previews a reading. Sources shows its metadata and recording configuration; a selected device lists its readings so you can configure one. Reporting shows events involving it. The chosen row is highlighted in the sidebar. Show all sources on the page clears the choice.
Choosing a branch also opens it. Opening or closing a branch with its chevron changes only what the tree shows, never the chosen source. The source is part of the URL, so links, reloads and the browser's Back and Forward buttons keep it. Workspace links carry it from one workspace to the next.
Browsing the catalogue
Brokers contain their devices, and devices may contain other devices. Below them
come MQTT topic levels. A level without branches is shown as one row, such as
weather/roof. Readings show their display name and unit; hover a row for its
full name and MQTT address. Readings a broker receives without a device sit
directly under the broker. An HTTP API is listed like a broker, with the levels
of its request paths below it, such as /v1/stations. Readings that have not received anything recently
stay in the tree.
Search matches names, identifiers, units and full MQTT paths. Results are a flat list, each with its topic and the device or broker it belongs to. Typing never changes the chosen source. Clear the search (Escape in the field) to return to the tree as you left it, with the same open branches and scroll position. Ctrl+K (Cmd+K on a Mac) opens the sidebar if needed and focuses search.
In the tree, Up and Down move between rows, Home and End jump to the first and last row, Right opens a branch or moves into it, Left closes it or moves to its parent, and Enter chooses the row. Collapse all closes every branch.
Choosing a collection narrows the tree to that collection's members. The tree then shows In followed by the collection's name, and Show every source (×) returns to the whole catalogue. Choosing a collection does not change the chosen source.
Showing and hiding the sidebar
Hide sidebar gives the page the full width; Show sidebar at the top left brings the sidebar back. Toggling it keeps the page at the same vertical position. Drag the sidebar's right edge to resize it, or focus the edge and use the arrow keys. Double-click the edge to restore the default width. The width, whether the sidebar is shown, open branches, folded categories, the chosen collection and the Recently active filter are remembered for your account in this browser. If browser storage is unavailable, they last for the session.
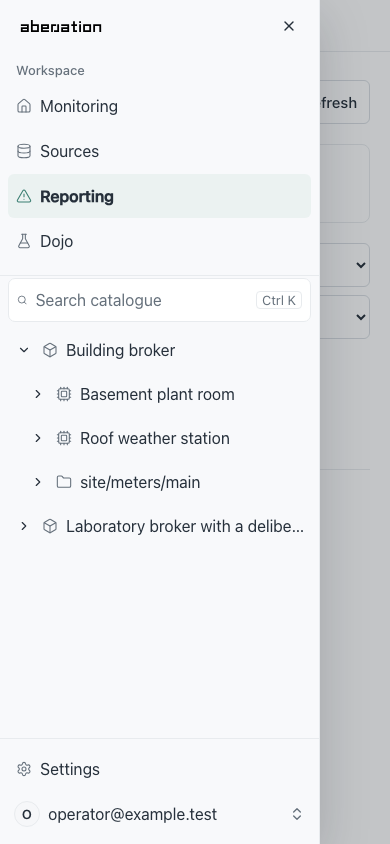
On phones, Show sidebar opens the same sidebar as a drawer. Choosing a workspace or source closes it. Close navigation, Escape or a tap outside also closes it, and focus returns to Show sidebar.
Authentication workflow
- Ask your organization administrator for an invitation.
- Open the invitation link and choose a password of at least 12 characters.
- Log in and receive a bearer token.
- The frontend API client attaches that token to subsequent requests.
Opening a protected link while signed out takes you to Sign in. After login, you return to that page with its selected item, filters and URL fragment intact. The destination also survives reloading the login page or signing in again after your session expires. Opening the login page directly takes you to Monitoring. Application invitations and member roles control access; the GitHub allowlist for infrastructure administration is separate.
With Remember this device, the access token stays in memory and is restored from an HttpOnly session cookie through /v1/auth/refresh; otherwise it lives in session storage for the tab. In local development, invitation and password-reset messages are available in Mailpit at http://localhost:8025.
Account → Signed in shows your email, your role and what it lets you change. Members whose role can manage members handle invitations, roles and access under Account → Members and Account → Roles. Disable a member to revoke their access. Once disabled, Remove permanently deletes their account and personal favorites after confirmation. Shared catalogue data, monitoring services and reports are kept. A removed member needs a new invitation to return. Every member can view the shared workspace and edit their own favorites. A role adds permissions to manage sources, monitors, alarms or members; Administrator holds all of them. Controls a role does not cover stay hidden.
Settings and system status
Open Preferences from the account menu at the bottom of the sidebar to choose Light, Dark, or Follow system under Appearance. Changes apply immediately and are saved in this browser on this device. Follow system also responds to changes in the device's appearance. Settings opens over the current page, preserving your workspace and unsaved input. Close it with the close button or Escape to return to the page.
Account, Preferences, Catalogue and System status share one settings overlay. It
opens above the page you are on, which keeps running underneath, and closing it
(the close button, Escape, a click outside or the browser's Back button) returns
you to that page as you left it. The open section is part of the address, for
example /sources?settings=status, so it can be linked to and survives a reload.
Switching sections does not add browser history.
Open System status from the account menu for live collection diagnostics, database size and
retention information. Collection status refreshes automatically every three
seconds; Refresh storage requests updated database measurements. The former
/system/status and /account/settings links open this section above Monitoring.
Select your email at the bottom of the sidebar to open the account menu with Account, Preferences, Catalogue, System status and Log out. Account shows who is signed in and, for members who manage members, member access and roles. Catalogue opens catalogue configuration; adding or editing an entry opens the editor on top of it. An empty catalogue also offers Open catalogue settings in the sidebar.
Readings and telemetry workflow
- Browse the MQTT catalogue or search for a reading.
- Select the reading in Monitoring to see its latest value, age and history. Hover over the age for the exact timestamp or open Source details for the catalogue path.
- Switch to Sources to inspect or change the selected reading's recording policy.
- Open its monitoring service to review detector evidence and configuration.
Device details at /details/:deviceId show a device's recorded readings with
category and time-range controls. Readings of a broker that have no device open
at /details/broker/:brokerId.
Data-source activity
Topic and reading circles in the catalogue show activity from a live preview or background recording. A filled circle means a fresh message arrived in the last 30 seconds. A hollow circle means the source is waiting for fresh data or is not listening; hover or focus the row to see its description. Retained snapshots and stored history do not count as fresh traffic. Browsing alone starts no collection.
The Recently active filter icon beside the Catalogue heading keeps filled-circle readings and the paths leading to them. It also filters search and the members of a chosen collection, updates as traffic starts or becomes stale, and remembers your choice in this browser. Favourites stay listed. Turn it off to show the full catalogue again. Filtering keeps the current source selected and does not start a connection or change recording. An empty filtered tree shows No recently active topics. with an underlined Show all topics action beneath it. This turns off the filter and keeps your open branches, search and source selection.
Configure recording under Sources. Broker and topic policies can cover several readings; review the affected scope before applying changes. Including readings added later requires an explicit opt-in. Roles that manage sources can also use View live to preview configured sources whose recording is off, and Stop live view to end that preview. Previewing does not enable background recording.
Add broker offers two types. An MQTT broker sends messages on topics. An
HTTP API is asked for a request path at an interval: give it a host, a port
and a scheme, then add readings with a request path such as
/v1/stations/7/latest and the payload field to read from the reply. Recording
an HTTP API starts at one request a minute; choose another interval under
At intervals. If the reply states when its value was measured, enter that
field as the reading's Source timestamp, and a repeated measurement is
recorded once. Your operator decides which APIs may be reached.
Favourites workflow
- Star a service in Monitoring or a reading in its preview.
- Select Favourites in the Monitoring service filters to show starred services.
- Starred readings and devices appear under Favourites in the sidebar; select one to choose it as the source.
Favourites belong to your account and follow you to every browser. Agents and
scripts read and change the same list through /v1/favorites.
Services workflow
The visual monitoring guide explains templates, the typed graph, reading selection and live inspection.
Open Monitoring at / to inspect monitoring services. The view refreshes service state and shows the strategy and processing stage reported by the backend. Removing a service also releases its claimed readings.
Reporting workflow
- Open Reporting at
/anomalies. - Review events grouped by day. Each event names its device, or its broker for readings without a device, and the readings it is about.
- Narrow the events by reading, time range and p-value. With several devices in scope, each reading is listed with its device's name.
- Follow an event to its Device readings, or Broker readings for readings without a device.
- Remove individual anomaly records when they are no longer required.
Dojo workflow
The Dojo tries detection designs on stored data before anything is monitored live. Nothing in it claims readings, starts monitors or writes to Reporting.
- Open Dojo at
/dojo. Upload CSV copies a file into a new dataset; Copy recorded readings copies the numeric readings of the device or reading selected in the catalogue: everything still stored, the last 30 days, 7 days or 24 hours, or a window you type. Copy to Dojo on a device's Reporting page, and on a reading or device preview in Monitoring, does the same for that device or reading without a catalogue selection and opens the new dataset. A dataset is frozen: retention and catalogue edits never change it. - Open a dataset. Values and labels shows its series; zoom the chart to a known problem and choose Use the zoomed range, or type the window, then Add label. Labels may touch but not overlap. For a dataset copied from recorded readings, Recorded alarms lists the alarms live monitors raised on those readings during its time span, grouped when they came less than ten minutes apart; Add as label keeps one as it is, Adjust puts it into the form first, and Add all as labels takes every one no label covers yet.
- Runs starts a run: choose a template or a design from the library, check which series feeds each input, and start it. The run replays the dataset in time order through the same alignment, learning and scoring as a live monitor; its progress updates while it runs. Tick Compare calibration methods to have the run also try the fixed split and every calibration method that adapts on its own detector scores. The run takes longer. A design that alarms on a conformal martingale has no boundary on its scores, so the option is off for it.
- Compare puts up to six finished runs side by side (the three newest are ticked when it opens): their alarms under the values, how many labels each detected and how soon, and how many false alarms each raised per day outside the labels. The best value of a metric is bold. Editing a label re-scores every run at once. Below, Calibration methods ranks what a run that compared them found: for each method, how many labels it would have detected and how soon, its false alarms per day and the share of results it would have alarmed on. Every method saw the same scores at the same alarm rate; the row marked This run is the design's own calibration step with its settings, the others run with their defaults. A method that stopped on an error is listed last with the reason and shows only what it found until then. To use a better method, change the design's calibration step.
- Use as template, on a finished run, saves its design to the template library; it needs the permission to manage monitors. Start a monitor then opens the template in Monitoring with each input set to the recorded reading its series was copied from, where that reading is still collected and fits. Inputs fed by an uploaded series are chosen there.
Expected errors and operator actions
| UI message pattern | Typical cause | Action |
|---|---|---|
| Login failed or unauthorized | Invalid credentials, expired session, or unverified account | Verify the account and sign in again |
| No brokers configured yet | The catalogue has no brokers | Add a broker in Sources or import a catalogue |
| Telemetry request failed | API or database latency/outage | Check API Gateway, TACTIC, and database health |
| Monitoring start failed | Invalid configuration, a reading that is not recorded as a number, readings of different devices, or orchestration failure | Record the readings under Sources, retry with defaults and inspect TACTIC logs |